This website has focused on college athletics and realignment for the last several years but once upon a time, horse racing was a frequent topic here. The pivot away from horse racing and to college realignment is for a separate time and article. I had planned to post this information following the 2024 Kentucky Derby; however, I did not feel the article was in a state to publish and no other time of the year makes sense to post about the Derby. Instead, I pushed the publish date back a year and wanted to do a bit more research related to some previous editions of the Derby.
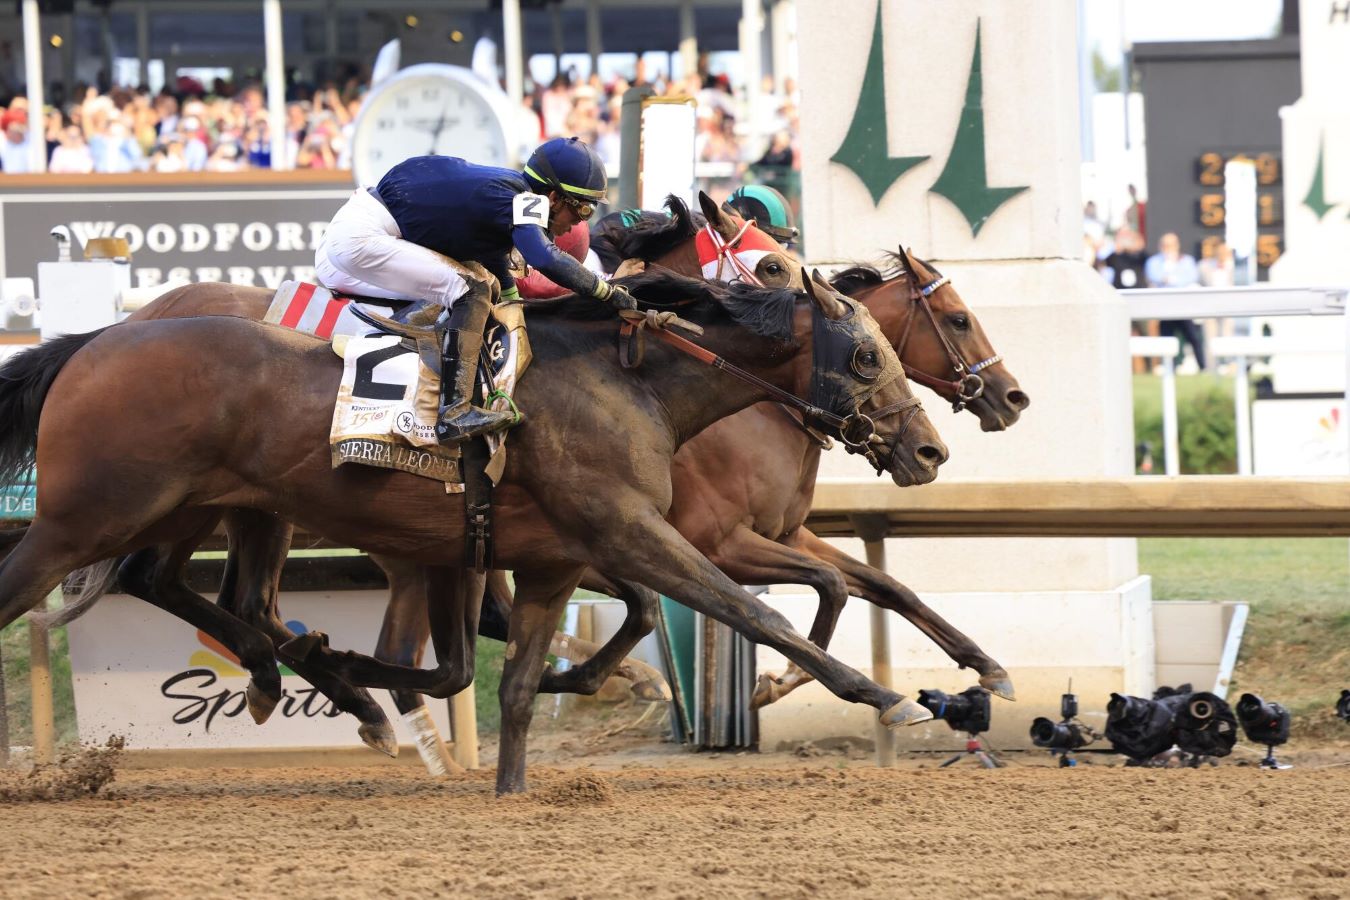
The exhilarating photo finish in the 2024 Kentucky Derby, won by Mystik Dan, capped a dozen runnings of the race since the introduction of the Kentucky Derby Points system. In a follow-up to the 2019 version of this article, I’ll examine some patterns that have emerged in the last quarter century, covering Derbies from before and after the implementation of the points system. The 12 runnings from 2001 through 2012 did not have a points system but instead used a graded earnings system to determine entrants. The 12 runnings from 2013 through 2024 used some version of a points system to determine which horses started in the Derby. Let’s start with the winners and favorites’ finishing positions for both eras.
Kentucky Derby Winners and How the Favorites Fared
The table below shows the winner, $2 win payout, $2 exacta payout (the top 2 finishers in exact order), the field size, and the finishing position of the favorite for each race from 2013 through 2024. The second table shows the same information for the Kentucky Derbies from 2001 through 2012. Averages are provided at the bottom of each table as well.
Under the new system, favorites did extremely well, as did the betting public. Favorites won the first six editions of the Kentucky Derby that featured the new system but it hasn’t been all roses since with the favorite failing to win any of the most recent six races. However, favorites are still running well with an average finish of 3rd in the last dozen years. Prior to the points system, favorites were more hit or miss with three winners in a five-year span and an average finish of 5th.
2013 – 2024 Kentucky Derby Winners
| Year | Winner | $2 Win | $2 Exacta Payout | Field Size | Favorite Finish |
|---|---|---|---|---|---|
| 2024 | Mystik Dan | $39.22 | $258.56 | 20 | 15th |
| 2023 | Mage | $32.42 | $330.44 | 18 | 3rd |
| 2022 | Rich Strike | $163.60 | $4,101.20 | 20 | 2nd |
| 2021 | Medina Spirit | $26.20 | $503.60 | 19 | 4th |
| 2020 | Authentic | $18.80 | $41.00 | 15 | 2nd |
| 2019 | Country House | $132.40 | $3,009.60 | 19 | 5th |
| 2018 | Justify | $7.80 | $69.60 | 20 | Winner |
| 2017 | Always Dreaming | $11.40 | $336.20 | 20 | Winner |
| 2016 | Nyquist | $6.60 | $30.60 | 20 | Winner |
| 2015 | American Pharoah | $7.80 | $72.60 | 18 | Winner |
| 2014 | California Chrome | $7.00 | $340.00 | 19 | Winner |
| 2013 | Orb | $12.80 | $981.60 | 19 | Winner |
| Averages | $38.84 | $839.58 | 18.9 | 3.1 |
2001 – 2012 Kentucky Derby Winners
| Year | Winner | $2 Win | $2 Exacta Payout | Field Size | Favorite Finish |
|---|---|---|---|---|---|
| 2012 | I’ll Have Another | $30.60 | $306.60 | 20 | 2nd |
| 2011 | Animal Kingdom | $43.80 | $329.80 | 19 | 8th |
| 2010 | Super Saver | $18.00 | $152.40 | 20 | 6th |
| 2009 | Mine That Bird | $103.20 | $2,074.80 | 19 | 18th |
| 2008 | Big Brown | $6.80 | $141.60 | 20 | Winner |
| 2007 | Streets Sense | $11.80 | $101.80 | 20 | Winner |
| 2006 | Barbaro | $14.20 | $587.00 | 20 | 7th |
| 2005 | Giacomo | $102.60 | $9,814.80 | 20 | 7th |
| 2004 | Smarty Jones | $10.20 | $65.20 | 18 | Winner |
| 2003 | Funny Cide | $27.60 | $97.00 | 16 | 2nd |
| 2002 | War Emblem | $43.00 | $1,300.80 | 18 | 7th |
| 2001 | Monarchos | $23.00 | $1,229.00 | 17 | 5th |
| Averages | $36.23 | $1,350.07 | 18.9 | 5.4 |
Kentucky Derby Splits and Winning Style
The following table shows the year, quarter-mile time, half-mile time, three-quarter mile time (6 furlongs), 1-mile time, final time, track condition, and winning style for each Kentucky Derby from 2013 through 2024. The second table shows the same information for the Kentucky Derbies from 2001 through 2012. Averages are provided at the bottom of each table as well. Please note that the Winning Style column on the right is subject to interpretation from person to person based on the results charts but consistency was applied as much as possible.
2013 – 2024 Kentucky Derby Times
| Year | 1/4 Time | 1/2 Time | 3/4 Time | 1 Mile Time | Final Time | Condition | Winning Style |
|---|---|---|---|---|---|---|---|
| 2024 | 22.97 | 46.63 | 1:11.31 | 1:37.46 | 2:03.34 | Fast | Mid Pack / Stalking |
| 2023 | 22.35 | 45.73 | 1:10.11 | 1:36.06 | 2:01.57 | Fast | Deep Closer |
| 2022 | 21.78 | 45.36 | 1:10.34 | 1:36.96 | 2:02.61 | Fast | Deep Closer |
| 2021 | 23.09 | 46.70 | 1:11.21 | 1:35.98 | 2:01.02 | Fast | Gate-to-Wire |
| 2020 | 22.92 | 46.41 | 1:10.23 | 1:35.02 | 2:00.61 | Fast | Gate-to-Wire |
| 2019 | 22.31 | 46.62 | 1:12.50 | 1:38.63 | 2:03.93 | Sloppy (Sealed) | Closer |
| 2018 | 22.24 | 45.77 | 1:11.01 | 1:37.35 | 2:04.20 | Sloppy (Sealed) | On The Pace |
| 2017 | 22.70 | 46.53 | 1:11.12 | 1:37.27 | 2:03.59 | Wet Fast (Sealed) | On The Pace |
| 2016 | 22.58 | 45.72 | 1:10.40 | 1:36.61 | 2:01.31 | Fast | Near Front / Presser |
| 2015 | 23.24 | 47.34 | 1:11.29 | 1:36.45 | 2:03.02 | Fast | Near Front / Presser |
| 2014 | 23.04 | 47.37 | 1:11.80 | 1:37.45 | 2:03.66 | Fast | Near Front / Presser |
| 2013 | 22.57 | 45.33 | 1:09.80 | 1:36.16 | 2:02.89 | Sloppy (Sealed) | Deep Closer |
| Averages | 22.65 | 46.29 | 1:10.93 | 1:36.78 | 2:02.65 |
2001 – 2012 Kentucky Derby Times
| Year | 1/4 Time | 1/2 Time | 3/4 Time | 1 Mile Time | Final Time | Condition | Winning Style |
|---|---|---|---|---|---|---|---|
| 2012 | 22.32 | 45.39 | 1:09.80 | 1:35.19 | 2:01.83 | Fast | Off Leaders / Stalking |
| 2011 | 23.24 | 48.63 | 1:13.40 | 1:37.49 | 2:02.04 | Fast | Mid Pack / Closers |
| 2010 | 22.63 | 46.16 | 1:10.58 | 1:37.65 | 2:04.45 | Sloppy (Sealed) | Off Leaders / Stalking |
| 2009 | 22.98 | 47.23 | 1:12.09 | 1:37.49 | 2:02.66 | Sloppy (Sealed) | Deep Closer |
| 2008 | 23.30 | 47.04 | 1:11.14 | 1:36.56 | 2:01.82 | Fast | Off Leaders / Stalking |
| 2007 | 22.96 | 46.26 | 1:11.13 | 1:37.04 | 2:02.17 | Fast | Deep Closer |
| 2006 | 22.63 | 46.07 | 1:10.88 | 1:37.02 | 2:01.36 | Fast | Off Leaders / Stalking |
| 2005 | 22.28 | 45.38 | 1:09.59 | 1:35.88 | 2:02.75 | Fast | Deep Closer |
| 2004 | 22.99 | 46.73 | 1:11.80 | 1:37.35 | 2:04.06 | Sloppy | Off Leaders / Stalking |
| 2003 | 22.78 | 46.23 | 1:10.48 | 1:35.75 | 2:01.19 | Fast | Off Leaders / Stalking |
| 2002 | 23.25 | 47.04 | 1:11.75 | 1:36.70 | 2:01.13 | Fast | Gate-to-Wire |
| 2001 | 22.25 | 44.86 | 1:09.25 | 1:35.00 | 1:59.97 | Fast | Closer |
| Averages | 22.80 | 46.42 | 1:10.99 | 1:36.59 | 2:02.12 |
Trends Comparision
When comparing the two sets of winners before and after the introduction of the points system, it’s clear that favorites are continuing to do well even if they don’t win. The average finish for the favorite since 2013 has been 3rd and that includes the 15th-place finish from the 2024 favorite Fierceness. In the dozen years prior to the Points System, the average finish was 5.4. Favorites have hit the board more often as well with 9 of 12 finishing in the top three compared to 5 of 12 in the old system.
Despite the favorites winning more often, the average payout is slightly higher in the past 12 years ($38.84) compared to the previous 12 years ($36.23). The reason for the higher $2 win average is the second and third-longest-priced horses to have won the Kentucky Derby occurred in 2019 (Country House at $132.40) and 2022 (Rich Strike at $163.60). The average $2 exacta payout (the top 2 finishers in order) is $840 since 2013 compared to the $1,350 average from 2001 through 2012. Not exactly a shocking result considering the favorite finished 1st or 2nd in 8 of the 12 Derbies since 2013.
One of the most important aspects of any race is how fast it is being run. Has the Kentucky Derby seen any changes to the internal fractions since the introduction of the Points System?
Well… the answer is yes and no. The early fractions are slightly quicker under the points system compared to the previous era. The quarter-mile time is 22.65 (since 2013) versus 22.80 (before 2013) and 46.29 for the half-mile compared to 46.42. The six-furlong time is almost exactly the same at 1:10.93 since 2013 and 1:10.99 from 2001 through 2012. The final time is about two lengths slower on average since 2013 at 2:02.56 compared to the 2001 through 2012 runnings, which averaged 2:02.12.
Below is a graphic that visually shows how the *average* race unfolds for both groups of years (2001 – 2012 and 2013 – 2024). It’s not done exactly to scale as Churchill Downs but the visualization would play out the same. Right around the 6 furlong marker, the 2013 – 2024 horse takes the lead and holds on to the finish.
Conclusion
None of what was presented above should be considered as betting advice. I merely observed what the data show over the last 24 years. The whole basis of a trend is that it can change at any time and the Kentucky Derby showed that in 2024 when the favorite finished 15th. It was the worst finish by a favorite since the points system was implemented in 2013 and the worst since 2009 when Friesian Fire finished 18th. That is just one example of a trend that can go wrong at any time. Consider the following results from the last 25 runnings of the Derby.
2003: Funny Cide was the first gelding to win the Derby since Clyde Van Dusen in 1929 and the first Derby win for a New York-bred.
2004: Smarty Jones became the first horse to win the Derby while undefeated since Seattle Slew in 1977.
2006: Barbaro became the first horse since Needles in 1956 to win with a five-week break between his last prep race and the Derby.
2007: Street Sense became the first two-year-old champion to win the Derby since Spectacular Bid in 1979.
2008: Big Brown becomes the first horse to win from post position number 20. He was also the first horse since Regret in 1915 to win with 3 or fewer starts before the Derby.
2011: Animal Kingdom became the first horse to win the Derby with a 6-week break between his final prep race and the Derby since Needles in 1956. He was also the first horse since Exterminator in 1918 to win with exactly 4 previous races (not counting Big Brown’s 3 or fewer).
2014: California Chrome became the first California-bred horse to win the Derby since Decidedly in 1962.
2016: Nyquist became the first horse since Majestic Prince in 1969 to be undefeated in 7 straight races leading up to the race.
2017: Always Dreaming becomes the first horse since Brokers Tip in 1933 to win the Derby without having won a race as a two-year-old.
2018: Justify becomes the first horse since Apollo in 1882 to win without racing as a two-year-old. He also won the Derby with 3 or fewer or fewer starts before the Derby.
2019: Country House is declared the winner of the Derby following the first disqualification of a first-place winner (Maximum Security) in history.
2020: The Derby was run on Saturday, September 5. It was the first time since 1945 that the Kentucky Derby was not run on the first Saturday in May, to say nothing of the abnormal prep schedules leading up to the race.
2022: Rich Strike becomes the second horse to win the Derby from post position 20.
2023: Mage becomes the 2nd horse in the last 6 runnings to win without a race as a two-year-old. Mage also won despite having 3 or fewer starts prior to the Derby.
Many “trends” have been broken in the last quarter century, and yes, some of the stats above are very specific. However, the main point is that some of these trends were broken because the fundamentals of horse racing have changed over time. Horses are racing fewer races leading up to the Derby now than before. Training regimens aren’t avoiding the dreaded “5-week” layoff coming into the Derby, which used to be a rule of thumb by previous generations. The idea that a horse needs a “good foundation of races” as a two-year-old doesn’t hold up the way it used to.
Every running of the Kentucky Derby is unique: the horses, the prep races, the training, the workouts, the trainers, the jockeys, etc. Then there are other factors like how the track is playing, the weather, how the race unfolds, whether strategies from the trainers and jockeys deviate from the previous races, the change in race-day medication and policies, or if there’s a scratch that alters the complexion of the race. All of that was leading up to the race, and the second the gates open, all that strategy and preparation can go out the window, leading to additional factors that cannot be accounted for. I haven’t even mentioned the 10 furlong (1 1/4 mile) distance, typically the longest distance a horse will race up to that point, or the rapid maturation horses can make over a few months.
No amount of trends can really help fans because every Kentucky Derby has its own idiosyncrasies. Every Kentucky Derby is unique and that’s why it’s become a yearly spectacle on the American sports calendar. Enjoy the Run for the Roses!
Photo Courtesy of Justin Casterline / Getty Images