
Four Year Trends Under The Kentucky Derby Points System
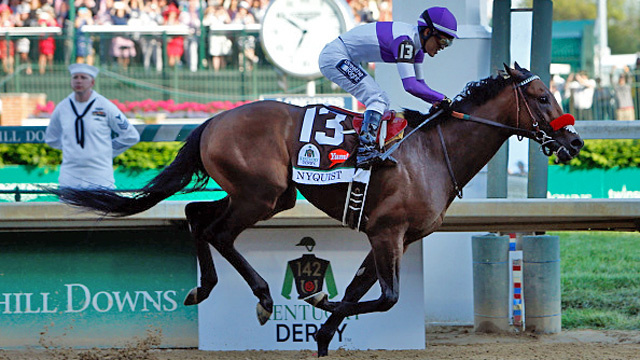
The dust has hardly settled on Nyquist’s win in the 142nd Kentucky Derby, but that does not stop us from looking back on his race as well several other Kentucky Derbies. 2016 marked the fourth year of the Kentucky Derby Points System that helps determine the entrants into the race. Below we will take a look at the last four years (2013 through 2016) under the Points System as well as the four years prior to the Points System (2009 through 2012).
Some trends have become apparent in the last few years, but keep in mind that 4 years of data is hardly enough to start planning a strategy around betting the 2017 Kentucky Derby. And anyone who has followed horse racing knows this sport can turn in a hurry. Let’s look at the first trend of the winners in the last eight years.
Favorites Dominate Kentucky Derby Under Points System
The favorites have won each of the first four runnings of the Kentucky Derby under the points system. In the four years prior to the Points System, the favorite never won and only one to hit the board was Bodemeister in 2012 with his wonderful front running effort. The tables below show each of the last 8 years.
| 4 Years Since Start of Kentucky Derby Points System | |||||
| Year | Winner | $2 Win | $2 Exacta | Field Size | Favorite Finish |
| 2016 | Nyquist | $6.60 (Fav) | $30.60 | 20 | Winner |
| 2015 | American Pharoah | $7.80 (Fav) | $72.60 | 18 | Winner |
| 2014 | California Chrome | $7.00 (Fav) | $340.00 | 19 | Winner |
| 2013 | Orb | $12.80 (Fav) | $981.60 | 19 | Winner |
| 4 Years Prior to Start of Kentucky Derby Points System | |||||
| Year | Winner | $2 Win | $2 Exacta | Field Size | Favorite Finish |
| 2012 | I’ll Have Another | $30.60 | $306.60 | 20 | 2nd |
| 2011 | Animal Kingdom | $43.80 | $329.80 | 19 | 8th |
| 2010 | Super Saver | $18.00 | $152.40 | 20 | 6th |
| 2009 | Mine That Bird | $103.20 | $2,074.80 | 19 | 18th |
One thing to keep is mind is that the favorites are so for a reason: they are considered to be one of the best going into the race. This is quite true for each of the last four horses. Nyquist was considered the best three year old, though there were concerns whether he could handle a mile and a quarter. American Pharoah and California Chrome were considered stand outs against their peers while Orb was a tepid favorite, but still highly regarded to get the distance and had a beloved trainer in his corner.
Even the exactas have gotten chalkier since the start of the Points System. Orb’s exacta paid just short of a grand, but is has been shorter since then including a paltry $30.60 with Nyquist and Exaggerator going 1-2 this year. It is hard to see the payout getting much smaller than that unless there are two towering choices in 2017.
California Based Horses Rise To The Top Under Points System
California horse racing is known for its speed. The horses are bred to go as fast as possible as soon as possible. That does not exactly seem like a recipe for getting a mile and a quarter, but we have seen a shift of 3 year old dominance to the West Coast.
Consider this: 4 of the last 5 horses to win the Kentucky Derby have spent significant time based in California during their two and/or three year old season.
Nyquist (2016): Ran five of his eight races in California. His three races outside of the state have been in Kentucky (Breeders’ Cup Juvenile and now Derby) and Florida (Florida Derby), which happens to be the site of his three biggest career wins.
American Pharoah (2015): Ran all three of his two year old races in California before being shipped between California and Arkansas for his Derby Preps. It worked well as he went on to become the first Triple Crown Winner since Affirmed in 1978.
California Chrome (2014): He ran 10 races in California prior to the Kentucky Derby.
Orb (2013): He wintered in Florida where he won three races before winning the Kentucky Derby.
I’ll Have Another (2012): He raced twice in California as a two year old before a poor race at Saratoga to end his season. At three, he stayed in California before heading to the Kentucky Derby.
Animal Kingdom (2011) and Super Saver (2010) were nomadic in their careers prior to the Derby. Mine That Bird (2009) did have a race in California as a two year old, but it was a stopover in the Breeders’ Cup after his career started in Canada. He eventually landed at Sunland Park before his unlikely Derby win.
For whatever reasons, California has churned out the Kentucky Derby prospects and they are not just winning. They are also doing well enough to hit the board the last two years. Nyquist and Exaggerator went 1-2 this year while American Pharoah, Firing Line, and Dortmund went 1-2-3 in 2015. Again, two years of data in dominating the exacta is far from a serious trend, but is still worth noting.
Position of Winners Under Points System
Another trend that has begun to emerge from the last four years is not just favorites or Californian horses winning the Kentucky Derby. It is also how they are winning the race. Each of the last three years the winning horses have been very close to the lead with none of the them being worse than third during their race. The tables below provide some insight as to where the winners were during their race.
| 4 Years Since Start of Kentucky Derby Points System | |||||||||
| Year | Winner | 1/4 Split | 1/2 Split | 3/4 Split | 1 Mile Split | Final Time | Field Size | Track Condition | Winning Style |
| 2016 | Nyquist | 22.58 | 45.72 | 1:10.40 | 1:35.61 | 2:01.31 | 20 | Fast | Near Front / Presser |
| 2015 | American Pharoah | 23.24 | 47.34 | 1:11.29 | 1:36.45 | 2:03.02 | 18 | Fast | Near Front / Presser |
| 2014 | California Chrome | 23.04 | 47.37 | 1:11.80 | 1:37.45 | 2:03.66 | 19 | Fast | Near Front / Presser |
| 2013 | Orb | 22.57 | 45.33 | 1:09.80 | 1:36.16 | 2:02.89 | 19 | Sloppy (Sealed) | Deep Closer |
| 4 Years Prior to Start of Kentucky Derby Points System | |||||||||
| Year | Winner | 1/4 Split | 1/2 Split | 3/4 Split | 1 Mile Split | Final Time | Field Size | Track Condition | Winning Style |
| 2012 | I’ll Have Another | 22.32 | 45.39 | 1:09.80 | 1:35.19 | 2:01.83 | 20 | Fast | Off Leaders / Stalking |
| 2011 | Animal Kingdom | 23.24 | 48.63 | 1:13.40 | 1:37.49 | 2:02.04 | 19 | Fast | Mid Pack / Closer |
| 2010 | Super Saver | 22.63 | 46.16 | 1:10.58 | 1:37.65 | 2:04.45 | 20 | Sloppy (Sealed) | Off Leaders / Stalking |
| 2009 | Mine That Bird | 22.98 | 47.23 | 1:12.09 | 1:37.49 | 2:02.66 | 19 | Sloppy (Sealed) | Deep Closer |
In the five previous Kentucky Derbies (2009-2013), runners close to the pace were usually nowhere to be found. As previously mentioned, Bodemeister set the pace in the 2012 Kentucky Derby won by I’ll Have Another and finished second. Shackleford tried to wire the field in 2011, but finished fourth by 3 3/4 lengths. Super Saver was close to the lead in terms of position, but was more than 5 lengths off the pace until the mile marker. Pioneerof the Nile (Sire of American Pharoah) was close throughout his Kentucky Derby run (never more than 3 lengths off the lead) while finishing second to Mine That Bird.
One of the hardest conclusions to draw is from race position. Each Kentucky Derby is completely different in how it is run. How many horses were setting the pace? Was there any pressure on the leader(s)? How was the track condition? How did the track condition affect the shape of the race? Did one of the speed horses not break well? Those are just a few of the many questions that can have different answers each year in how the race was run.
Nevertheless, the trend is there that horses near the front are doing well. However, keep in mind that the last three years, the top 3 year old entering the Derby was considered above the rest of the crop. Perhaps this is nothing more than the best horse in the race having a similar style and just being better than their peers.
Speed Under the Kentucky Derby Points System
Last year I postulated that the Kentucky Derby was slowing down in terms of time. After three years of data it appeared to be correct, but then 2016 happened. This year the Kentucky Derby went in 22.58 for the quarter and 45.72 for the opening half-mile. 2015 saw the same fractions go in 23.24 and 47.34, respectively. As stated two paragraphs above, the shape of the race is contingent on many different factors. The draw, the track condition, if a bias is present on the track, the break at the start of the race, etc. all can completely change how a race is run and won, especially in a race with as many as 20 horses.
Conclusion
What you have read above was worth pointing out, but by no means should sculpt one’s handicapping for the 2017 Kentucky Derby. The favorites have dominated the last four years and the winner has run the same race in the last three years. Does that mean it will continue? Not at all, but the trend can also still continue in 2017.
What makes the Derby so different (and difficult) is there is no race to compare it. There are no other races for 3 year olds that are run at a mile and a quarter AND allow 20 horses. The uniqueness of it allows it to be one of, if not the, most popular races each year. That uniqueness also makes it hard to find parallels as noted above.
Horse racing is a fickle sport. The highest highs can be followed by the lowest lows. The trends laid out above could easily be blown apart when a horse completely changes tactics (see Palace Malice in the 2013 Kentucky Derby). A real, concrete pattern may not emerge for another decade or more (four years is hardly a great basis for drawing a solid conclusion). A lot of things can change in the next decade which may show this four year trend as an anomaly.
One trend that will not probably change is my picking of the Kentucky Derby Toss. I had #9 Destin this year and he finished 6th. In addition, there will probably be an article like this one looking back at five year trends instead of four year trends. Enjoy the Triple Crown!
Nyquist won the Florida Derby, which is in FLORIDA!